
|
iQue Forecyt® Reference Guide (Version 9.0)
|
Overview of the Analysis Screen
When you first click on the Analysis tab, the window opens with a FSC-H by SSC-H plot of All Events.
Note: All Events means everything acquired from the instrument, not just cells or beads
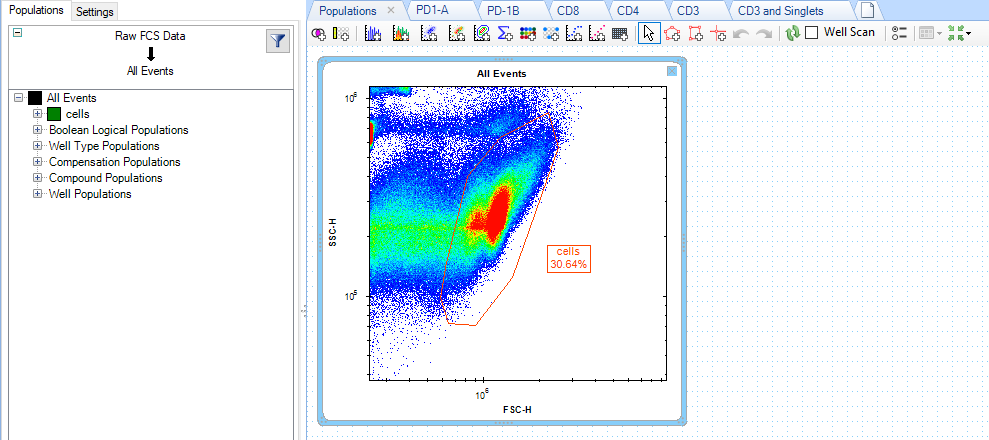
In this screenshot we’ve gated the Beads. There are two tabs on the Analysis side bar, Populations and Settings. (1) You can toggle back and forth between them. The Population hierarchy (2) is selected in this example. There are icons for all the operations you can perform in Analysis. (3)
